Template reports are automatically created and these reports have the same rows and time bucket as the submission template. It is a quick way of consolidating the figures into one currency and including all subsidiaries. Each Legal entitys figures will be consolidated to their home currency.
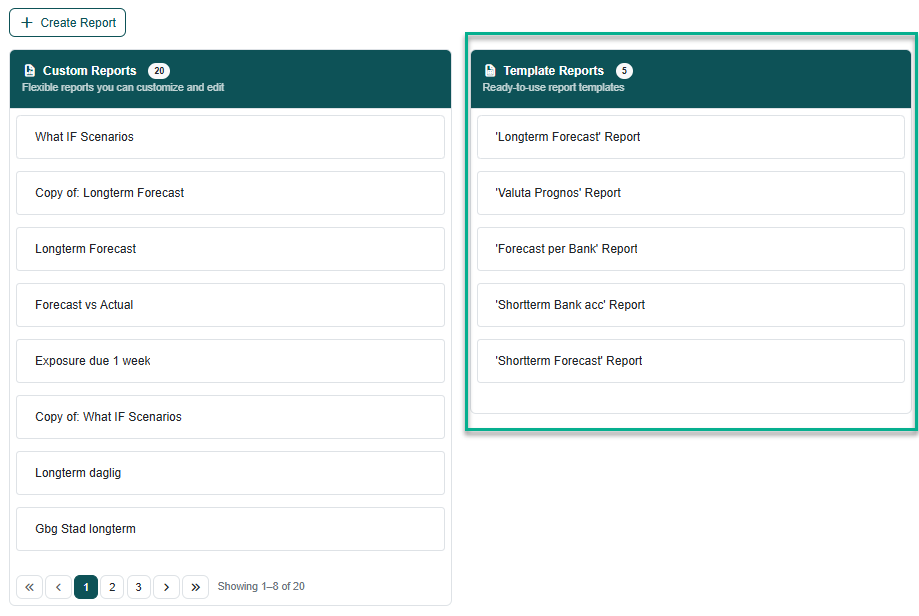
There are template reports available to the right
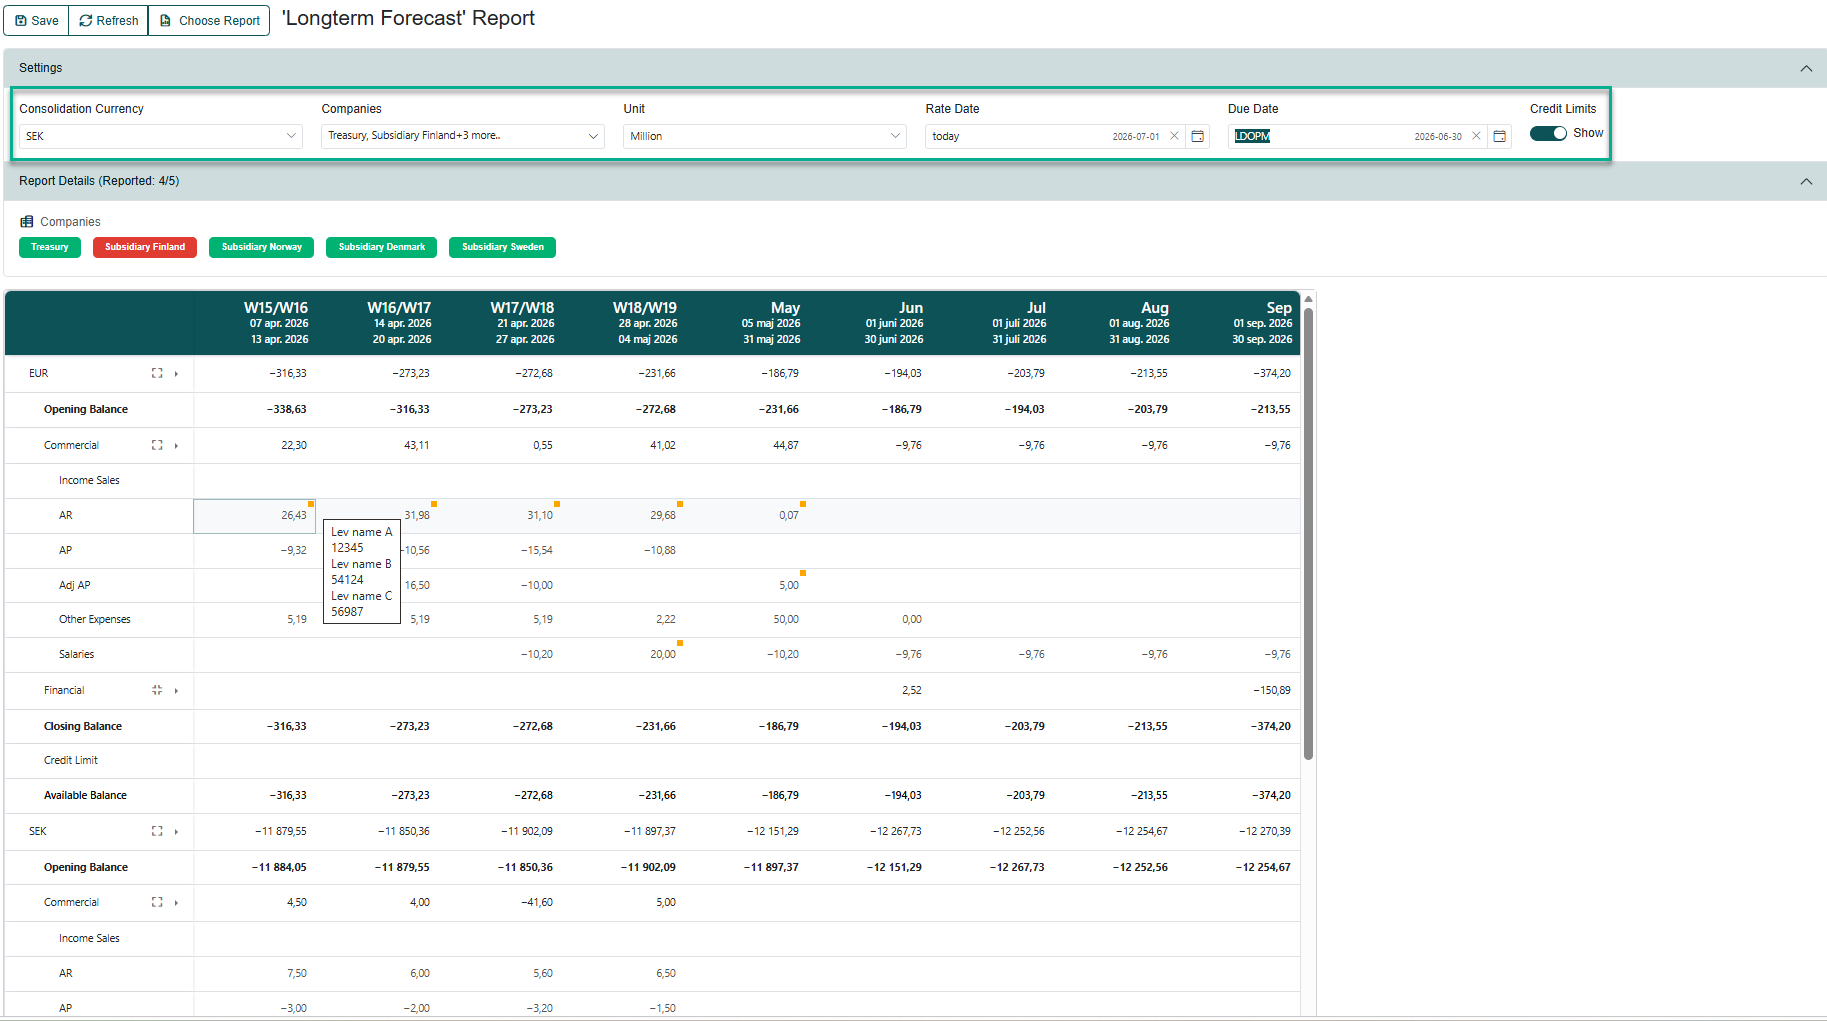
Some selection at the top section of the template report is available
Consolidation currency: If no consolidation currency is selected all figures will be shown in original currency.
Companies: Select the companies you want to include
Unit: Select unit to view the figures
Rate Date: possible to add date codes as well. Today, -2 bd, LDOPM etc
Due Date: Select which forecast you want to see specific forecast date or date code e.g. Latest, current
Report details also shows how many companies for the selected forecast has Completed the forecast if 4/5 4 has completed the forecast and 1 company has not completed the forecast.
Credit limit: If activated it will show available cash (undrawn amounts in credit facilities) which also be visualised in the report. To see if there are forecasted negative balances, will the headroom in credit facilities cover the deficit?
Comments: Are shown with a orange dot. Imported comment on forecast transactions such as Invoice no or supplier name or added comments by the subsidiaries will be visable.
To create a new report, click create Report

Start by giving the report a name and expanding the settings section.
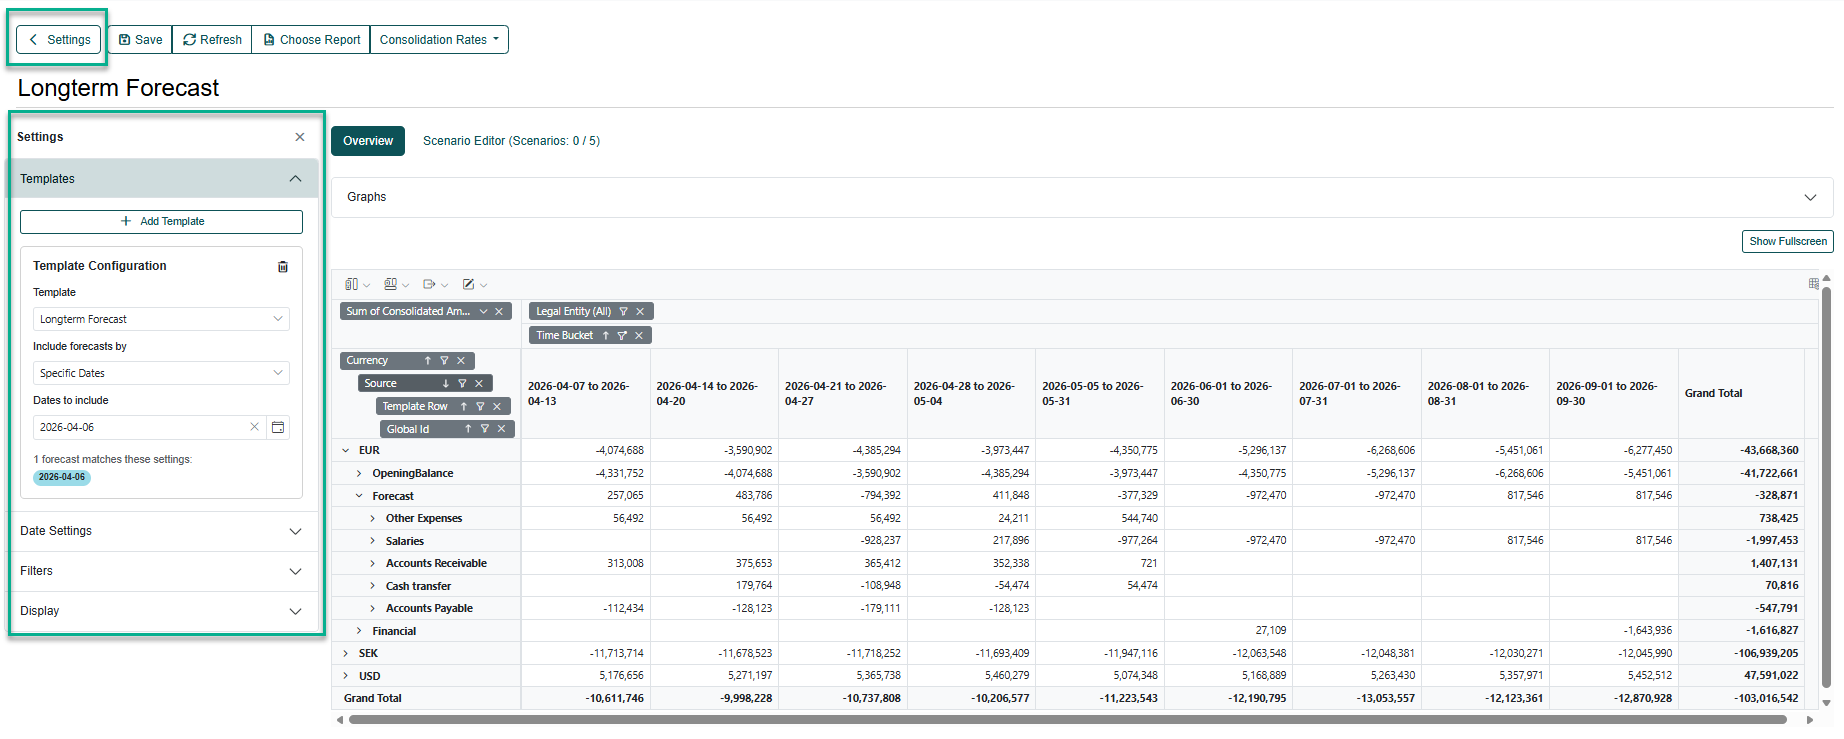
Templates
Template: Select the template that should be the base of the report.
Include forecast by:
- Select Latest, and choose number if you want to compare e.g. the latest 2.
- Specific date, select date or date code
- Date range if many forecast done during a secific period should be included.
It is possible to click add template and include multiple template. If the templates timebucket are overlaping we will show the cash flows from both templates in the overlaping periods.
The only mandatory fields are template, forecast date and time buckets.
Note! For a subsidiary user, the report will only show the legal entity to which they have permission.
Date settings
Time buckets: Are where you define the time intervals you would like to see in the report. It does not have to be the same time buckets as in the template. The cash flows will be shown on their specific payment date and if an amount is entered for a specific time bucket it will be split evenly for the chosen time bucket. E.g. Monthly figure of 30 million will be split to 1 million per day.
Rate Date: Select the FX rate table you want to use either specific date or date code. Date from the date code will be visulised in the field.
Balance date if you want to run the report from a specific date today even though you have other reporting periods. Opening balance as of today and new imported AP and AR and updated financial flows will be shown in the report.
Filter
Select the Companies, Currencies, Internal/External or Forecasted Status that should be included.
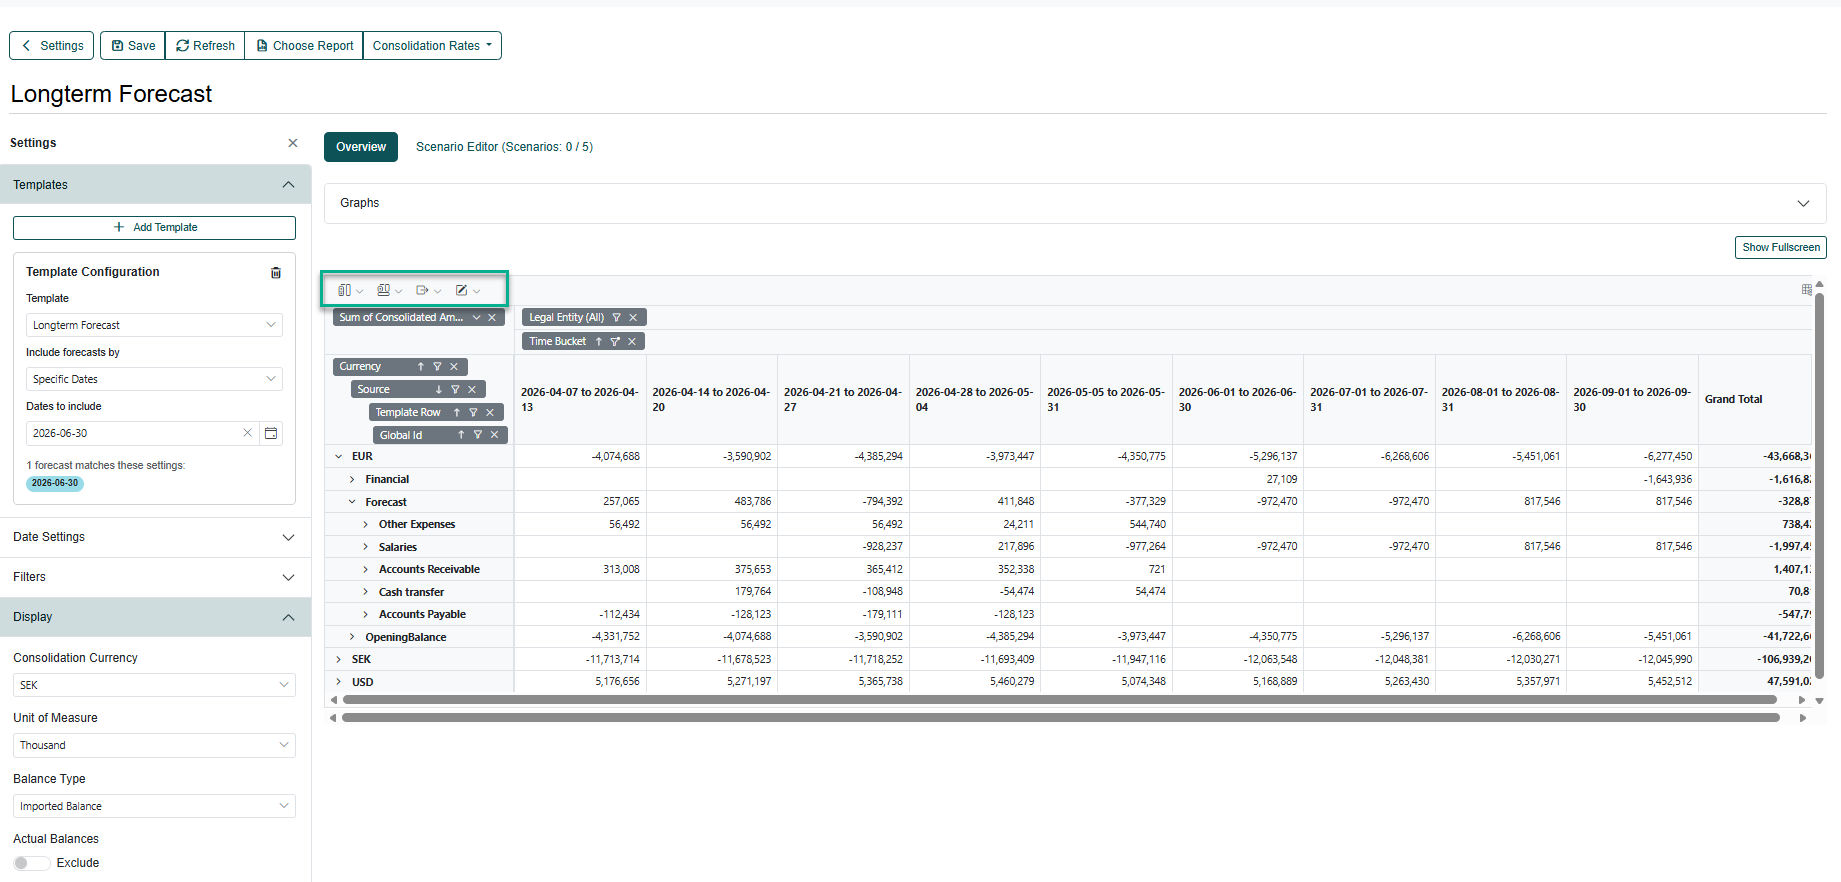
Display
Consolidation Currency: If you would like to consolidate the amounts to a certain currency, the default (if it is left blank) it will pick the rates from the Due date of the Forecast available in Treasury Systems, or you can select a specific FX rate table.
Unit of Measurement: You can also decide in which unit the amounts should be shown in the Pivot Table.
Balance Type: Specifies if you want to have opening balance updated with imported balances or opening balance from the submitted forecasts.
The Actual Balances: are used if you would like to compare the forecast with Actual imported balances from the bank accounts. To see the historical forecast how close they were to actual.
Report (Pivot Table)
By default the Pivot table will show the Sum of Amount and be grouped by Currency, Source and Template Row in Time buckets.

In the field list, you can design the Pivot table by selecting different rows and columns.

If the amount is to be consolidated, a consolidation currency must be selected.
In the pivot grid below, you can add more columns by clicking on the icon to the right (see below). You can also add a calculating field based on other columns to view the difference between 2 columns.
The Icons in the top left are:
- Change subtotals
- Change grand totals
- Export data to CSV, Excel and PDF
- Change the number format and add conditional formatting to highlight specific figures.
Graph in reports
It is possible to add two graphs to the report. Select the graph type on the icon to the left and choose the content in the graph by clicking on the icon to the right. See marked in print screen below.

It is possible to add What if scenarios in reported cash flow forecast please see article What If scenarios
Was this article helpful?
That’s Great!
Thank you for your feedback
Sorry! We couldn't be helpful
Thank you for your feedback
Feedback sent
We appreciate your effort and will try to fix the article